Dashboard design: For products with more data than people can read
For products where the data is the product: analytics, financial positions, infrastructure status, agent activity. I decide what each person needs to see first, design the dashboard and its charts with every state, and hand over Figma on your design system or the front end in code. I have designed dashboards and data views for a crypto analytics platform, a DeFi lending protocol, an interchain trading platform and an AI agent product, and set the design system of a distributed cloud platform.
To start, email andriy.dsgn@gmail.com with a link to the product and the view people struggle with.
Signs a dashboard needs it
- Every number has the same weight, so nothing reads as important.
- People export to a spreadsheet to answer the question the dashboard was built for.
- Charts were added one feature at a time and no longer agree on colours, scales or periods.
- Empty, loading and error states were never designed, so new accounts see a broken page.
- Experts and newcomers share one view, and neither finds what they need.
What I design
- The order of attention: what each type of user must see first, second, and only on request.
- Charts and metric components that share scales, periods and colours, built into the design system.
- Every state: empty, loading, partial data, errors, and the first day of a new account.
- Drill-down and filters that keep people oriented.
- Dense and simple modes where experts and newcomers share the product.
How it runs
- Audit. What the dashboard shows, who reads it and what they do with it.
- View list. The views worth redesigning, each with its price.
- Design. Each view with its charts, components and states.
- Handover. Figma on your design system, or the front end built in your repository.
Where the experience comes from
| Product | What I designed |
|---|---|
| Volterra | The design strategy and the design system the whole design team worked from, for a distributed cloud platform |
| Santiment | Interface components and metric visualizations for a crypto market data and analytics platform, with user interviews and usability tests to find where the product lost people |
| TrueFi | A modular dashboard that brought lending, staking and farming data together |
| Stakenet | A financial dashboard and data visualization for an interchain trading platform, with a brand refresh |
| Deva | The Karma dashboard of an AI agent platform: the balance, earnings and spending, and the transactions behind them |
| Fully AI | The dashboard of an AI agent product, rebuilt with its design system in one month |
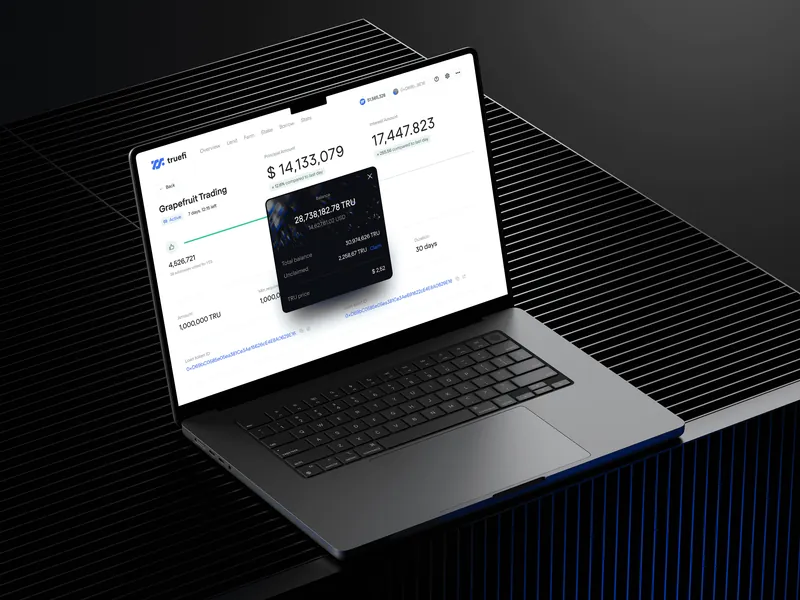
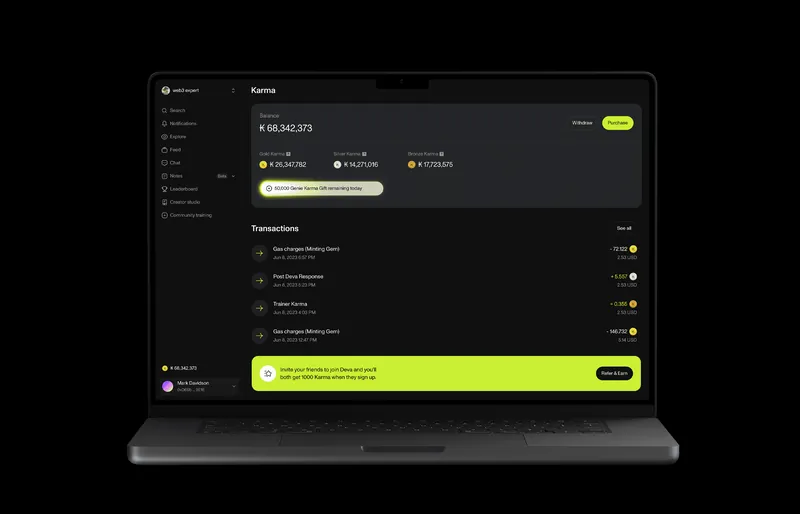
My part in each is on the case page or on About.
Questions teams ask
How much does dashboard design cost?
Each view is priced after a short audit and agreed before work starts. A whole analytics product is priced view by view, so you know the total before work starts.
Can you work with our charting library?
Yes. I design to what your front end can render, and I can build the charts in code myself.
Do you design for real data or placeholder data?
Real data where I can get it. Placeholder numbers hide the cases that break a dashboard: long names, zero values, one account with ten times the data.
Do you work with teams in other countries?
Yes. I work remotely, with teams in different countries and time zones.
Other ways I can help
- SaaS UX redesign, quoted per flow: for products that are powerful and confusing.
- Design systems, from $700: a Consistency Review, then a system agents follow.
- Web3 and DeFi product design, from $8,000 a month: for protocols people have to trust.
Further reading: TrueFi: a lending protocol. All services, with the situation each one fits: Services.
Is your dashboard hard to read?
Send a link and a line about who uses it and what they need from it. If it’s not a fit, I’ll say so.